While the bears dominated price action early last week, the bulls managed to show strong support below $100,000. Bitcoin price dropped briefly below $100,000 on Tuesday, Wednesday, and Friday, but buyers stepped in each of those days to push the price back above $100,000, avoiding a daily close below this key level. A small weekend rally allowed the bitcoin price to reclaim the $104,000 support, closing at $104,700. Heading into this week, look for the $109,400 resistance level to keep a lid on things, with $111,000 looking like strong resistance if the price can go beyond there.

Key Support and Resistance Levels Now
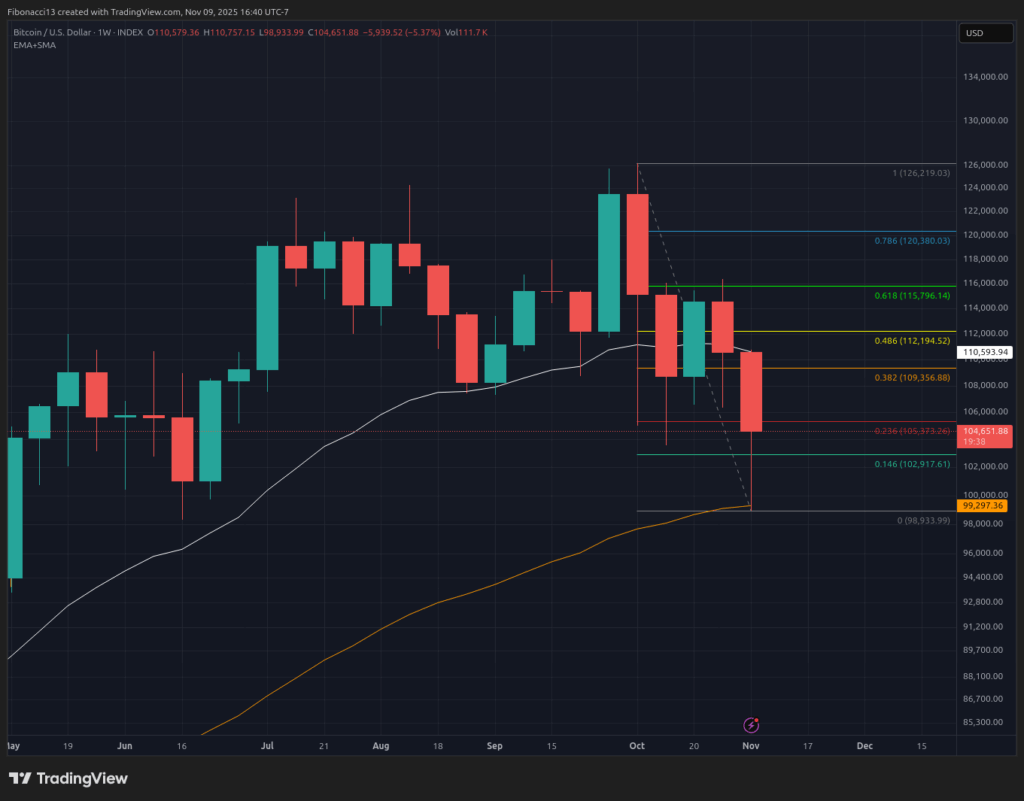
The weekly 55 EMA at $99,000 provided strong support each time the price lost $100,000 last week. Bulls stepped up at this level, front-running the $96,000 bull market support level. Going forward, bulls will look for the 55 EMA to hold as support after such a large move off of this level last week.
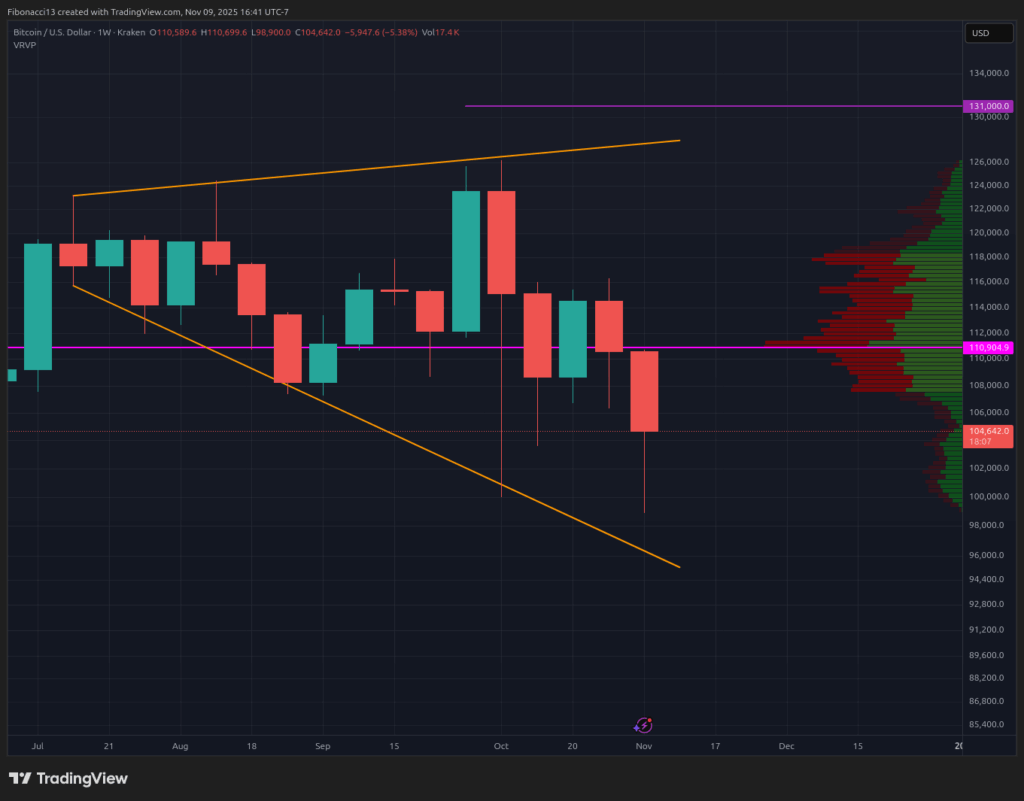
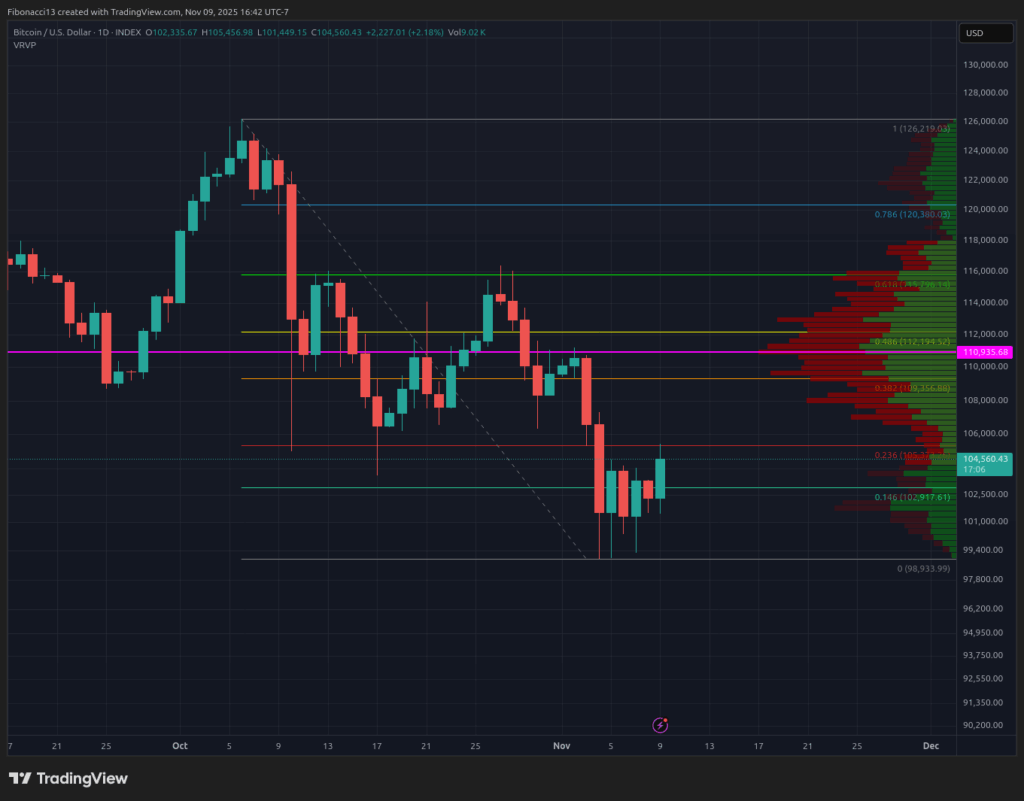
As the bulls attempt to barge onward, the 0.382 Fibonacci retracement at $109,400 should provide some resistance. Above here, bears will look for the daily point of control at $111,000 on the volume profile to hold back the bulls. Beyond this level, $116,000 sits as a gatekeeper for the bears, as closing above this level will flip bias back over to the bulls. Market structure looks decisively more bullish if the 0.618 Fibonacci retracement at $116,000 can be converted to support. Bulls may see a little resistance at $129,000 at the top of the broadening wedge pattern if they manage to reclaim $116,000 as support, but I would not expect $129,000 to hold for long if price does indeed reach it.

Outlook For This Week
Rumours of the US federal government shutdown ending this week are prevalent. If both parties can manage to sort out the filibuster, markets may get a boost this week. Bulls will look for the 0.146 Fibonacci retracement at $102,900 to hold as support on the daily chart early this week, to maintain upward movement. The daily chart may struggle to close above the 0.382 Fibonacci retracement at $109,400 even if it gains some more momentum. Losing $100,000 this week would be very bearish and likely lead to a test of $96,000 at minimum, with potential for the price to crash even lower to $93,000 and possibly even $84,000 below that.

Market mood: Bearish – Despite the strength shown by the bulls last week, the outlook is still bearish if we are being honest here. A large red weekly candle close is still bearish.
The next few weeks
The broadening wedge pattern we have been watching for weeks here is not broken yet. So there’s still a chance the bulls can bring the price back to the top trend line around $129,000. Bias is still in favor of the bears here, though, as currently, this pattern is still likely to break to the downside. $116,000 is the key level bulls need to re-establish as support to get the price moving back to new highs. While the government shutdown was not overly bearish on markets initially, the long duration of it is starting to take a toll. If the US federal government can indeed get back to work soon, it should provide a boost to the Nasdaq, and in turn, this should help provide supportive conditions for the bitcoin price to reclaim some key resistance levels. Any major macro bearish events incoming likely put an end to bitcoin’s bull market, so overall conditions need to remain stable to foster more upside.
Terminology Guide:
Bulls/Bullish: Buyers or investors expecting the price to go higher.
Bears/Bearish: Sellers or investors expecting the price to go lower.
Support or support level: A level at which the price should hold for the asset, at least initially. The more touches on support, the weaker it gets and the more likely it is to fail to hold the price.
Resistance or resistance level: Opposite of support. The level that is likely to reject the price, at least initially. The more touches at resistance, the weaker it gets and the more likely it is to fail to hold back the price.
EMA: Exponential Moving Average. A moving average that applies more weight to recent prices than earlier prices, reducing the lag of the moving average.
Fibonacci Retracements and Extensions: Ratios based on what is known as the golden ratio, a universal ratio pertaining to growth and decay cycles in nature. The golden ratio is based on the constants Phi (1.618) and phi (0.618).
Volume Profile: An indicator that displays the total volume of buys and sells at specific price levels. The point of control (or POC) is a horizontal line on this indicator that shows us the price level at which the highest volume of transactions occurred.
Broadening Wedge: A chart pattern consisting of an upper trend line acting as resistance and a lower trend line acting as support. These trend lines must diverge away from each other in order to validate the pattern. This pattern is a result of expanding price volatility, typically resulting in higher highs and lower lows.


