Bitcoin Price Weekly Outlook
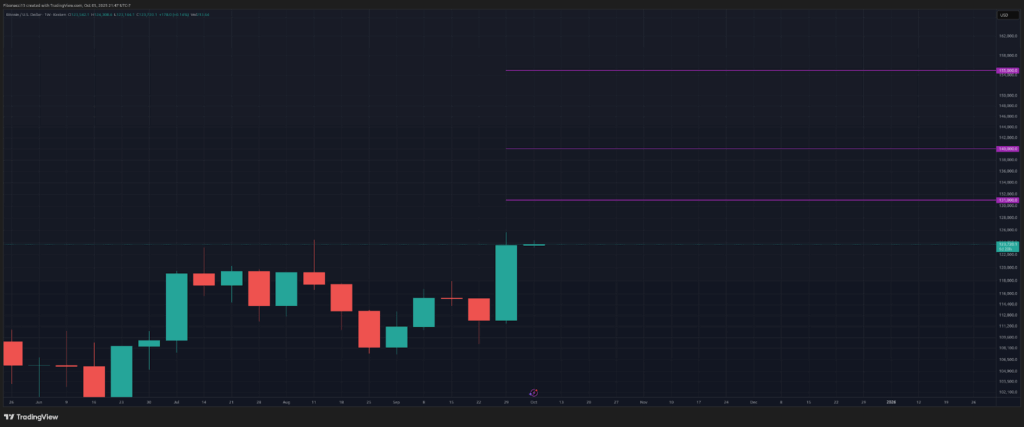
Wow, what a difference a week makes! Bitcoin started last week out just below resistance, then blasted right on through it, with some very strong buying pressure throughout the week. The bulls are back in control after taking out all short-term resistance levels. Bitcoin price is now in what is referred to as a “blue sky breakout”, where the price reaches a new all-time high and goes into price discovery mode as all buyers who didn’t sell on the correction are now in profit. It has truly been an impressive week for the bulls, generating the highest weekly closing price bitcoin has ever seen at $123,515.
Key Support and Resistance Levels Now
Now that the price has reached new highs, determining where resistance may come in is a very difficult task. We have no prior price levels to focus on, so any levels we do come up with using technical analysis will be more theoretical than practical. Using Fibonacci extensions from the recent pullbacks, however, we can see that $131,000 may act as a bit of a barrier if this breakout continues. Above there, we have some minor confluence at $135,000 and again at $140,000. If these levels are broken, we can look to the 2.618 Fibonacci extension from the 2021 high to 2022 low, resting at $155,000.
If price pulls back from here, we will look down to the $118,000 level as support, with a good chance that level will be front-run by greedy buyers if we do see any significant dip back down. Closing a week below this level would open up $114,000 as the next support level, where the bullish trend could still resume if it held. A price closing below $114,000 would flip the overall market structure to bearish, and we would be looking down to the $105,000 level for support, while once again questioning if the market top is in for the foreseeable future.

Outlook For This Week
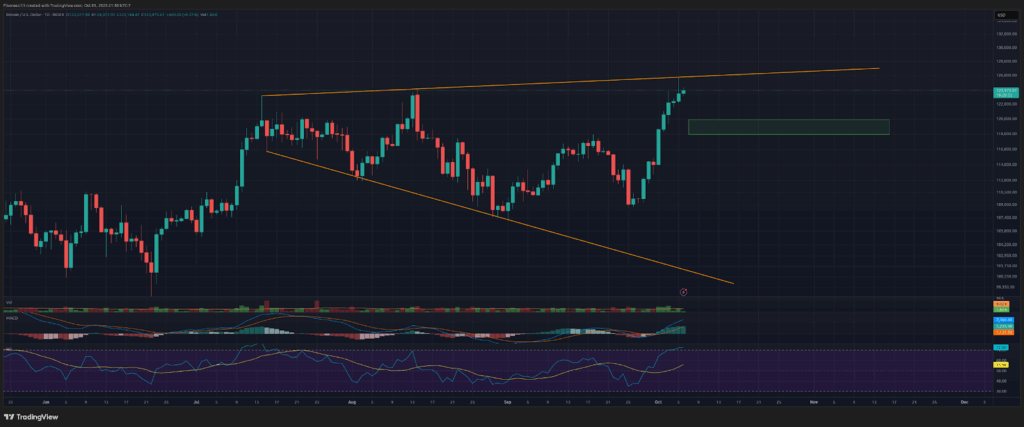
Examining the daily chart, we can see that the broadening wedge pattern is now fully established. Sunday night saw the price hit the upper trend line resistance of this pattern, so it is possible we see a shallow pullback over the coming days before the price can break out of this pattern. So, be wary of a dip by Tuesday/Wednesday here, but if it comes, we should expect the $120,000 to $118,000 zone to hold as support. If price can manage to close a couple of days above the upper trend line later this week, we should see price acceleration into the $130,000s.

Market mood: Bullish — Bitcoin price moved above all outlined resistance levels to close at a new all-time weekly high. Bulls are now firmly in control, and the bears are back on their heels.
The next few weeks
Bitcoin does not seem to care about the government shutdown, and the case could be made that Bitcoin is even stronger because of the shutdown. Over the coming weeks, we should expect the bitcoin price to continue higher. Last week’s close brought the weekly RSI back above the 13 SMA, and it is once again in bullish posture. The MACD oscillator is close to crossing bullish as well, and will do so if bitcoin closes above $125,000 to end this week. Both of these oscillators will only add more reasons for investors and traders to remain long bitcoin. Bears will need to see some heavy selling volume and prices below $118,000 in order to try to regain control from the bulls over the next several weeks. The bears will want to see a big miss for October’s CPI report, or some other type of macro bearish event, in order to stand a chance of holding back the bulls here over the coming weeks.
Bulls/Bullish: Buyers or investors expecting the price to go higher.
Bears/Bearish: Sellers or investors expecting the price to go lower.
Support or support level: A level at which the price should hold for the asset, at least initially. The more touches on support, the weaker it gets and the more likely it is to fail to hold the price.
Resistance or resistance level: Opposite of support. The level that is likely to reject the price, at least initially. The more touches at resistance, the weaker it gets and the more likely it is to fail to hold back the price.
SMA: Simple Moving Average. Average price based on closing prices over the specified period. In the case of RSI, it is the average strength index value over the specified period.
Fibonacci Retracements and Extensions: Ratios based on what is known as the golden ratio, a universal ratio pertaining to growth and decay cycles in nature. The golden ratio is based on the constants Phi (1.618) and phi (0.618).
Broadening Wedge: A chart pattern consisting of an upper trend line acting as resistance and a lower trend line acting as support. These trend lines must diverge away from each other in order to validate the pattern. This pattern is a result of expanding price volatility, typically resulting in higher highs and lower lows.
Oscillators: Technical indicators that vary over time, but typically remain within a band between set levels. Thus, they oscillate between a low level (typically representing oversold conditions) and a high level (typically representing overbought conditions). E.G., Relative Strength Index (RSI) and Moving Average Convergence-Divergence (MACD).
MACD Oscillator: Moving Average Convergence-Divergence is a momentum oscillator that subtracts the difference between two moving averages to indicate trend as well as momentum.
RSI Oscillator: The Relative Strength Index is a momentum oscillator that moves between 0 and 100. It measures the speed of the price and changes in the speed of the price movements. When RSI is over 70, it is considered to be overbought. When RSI is below 30, it is considered to be oversold.


